
Yuyao Grand Theater Acoustic Design Brief
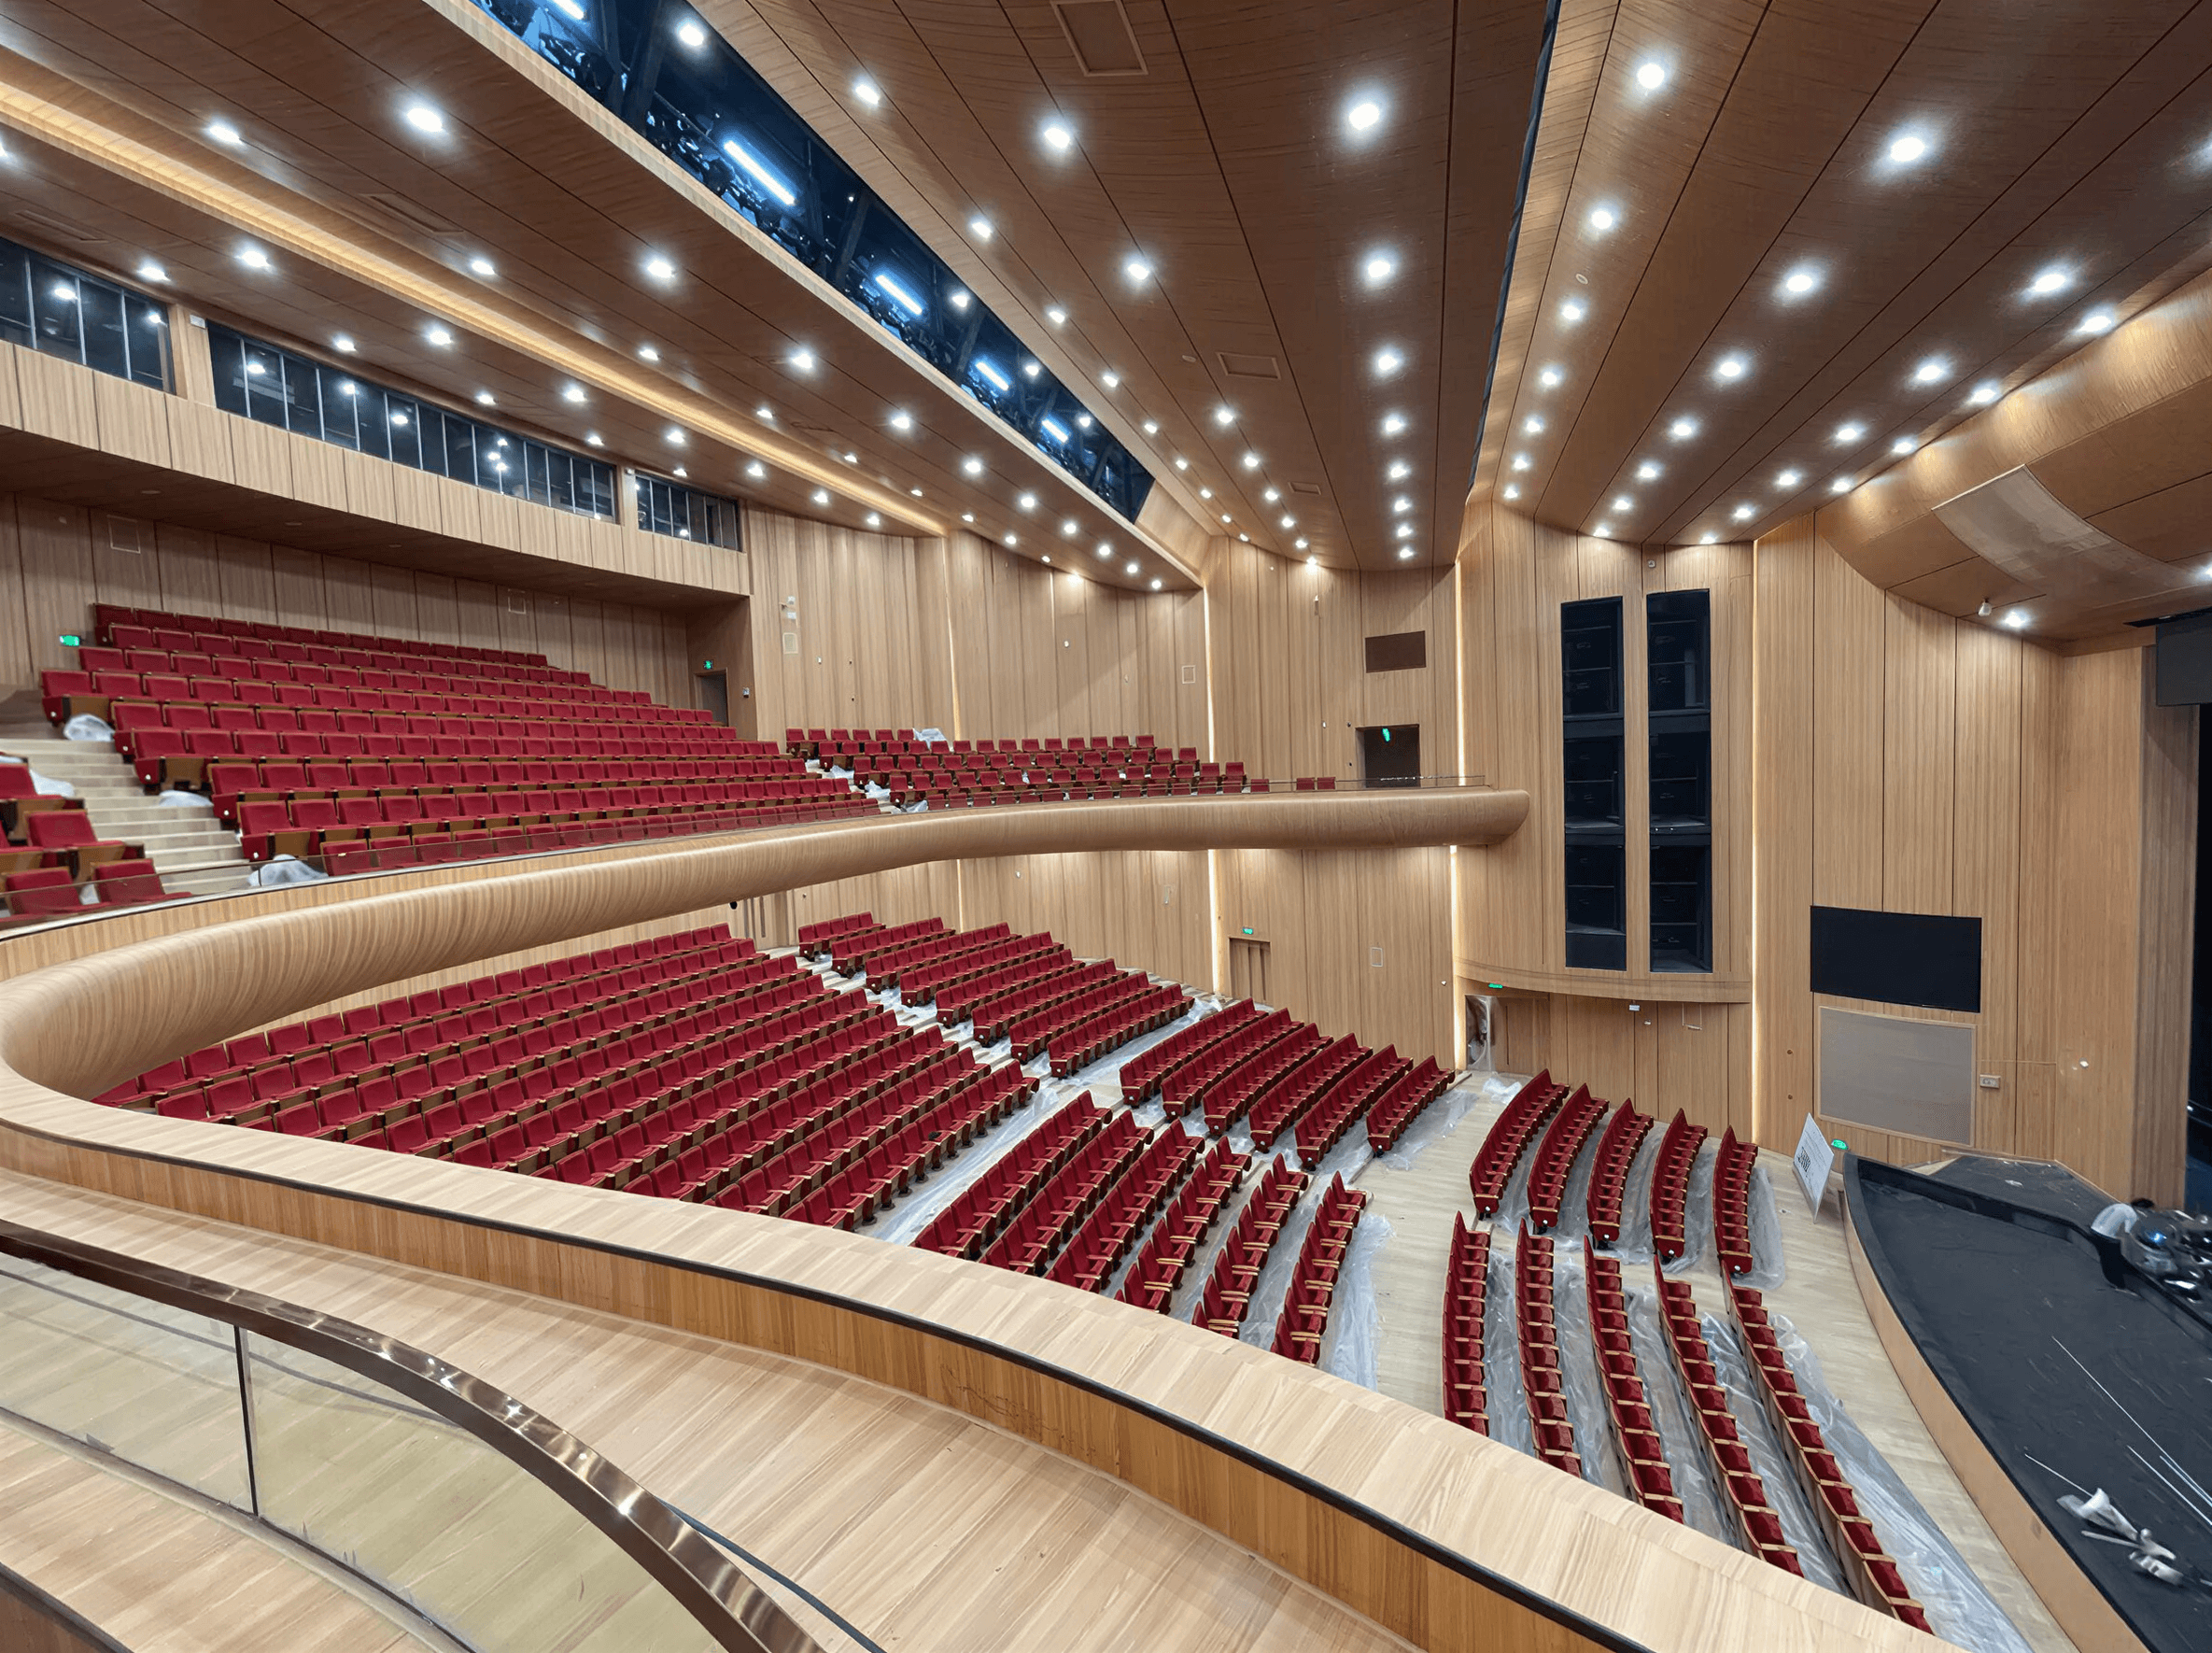
Yuyao Grand Theater is a 1,200-seat Class B performing arts venue designed for opera, dance drama, spoken theater, conferences, and chamber music. Its horseshoe auditorium measures approximately 32m long, 29m wide, and 13.5m high, with 8.8m³ of room volume per seat.
The stage follows a conventional proscenium layout with side and rear stages. Two front-lighting bridges, two side-lighting positions, and one follow-spot bridge had to be coordinated with the acoustic envelope, proscenium loudspeaker openings, and rear control rooms.
The primary acoustic targets include a mid-frequency full-occupancy reverberation time of 1.40±0.10s, or 1.70±0.10s with the orchestra shell deployed for chamber music. The design also targets a bass ratio of 1.1 to 1.3, a high-frequency ratio of 0.8 to 1.0, background noise of NR-30, and no echo, multiple echo, flutter echo, sound focusing, or resonance at any position within the auditorium.
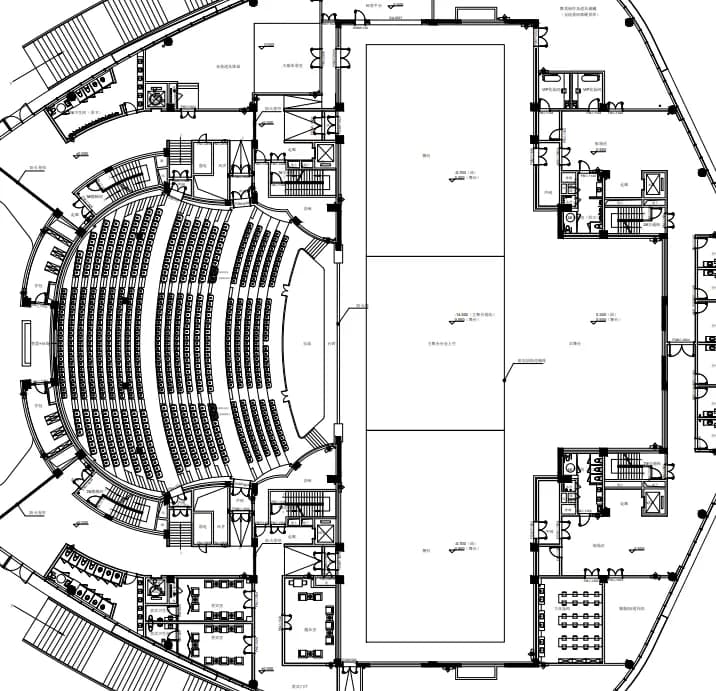
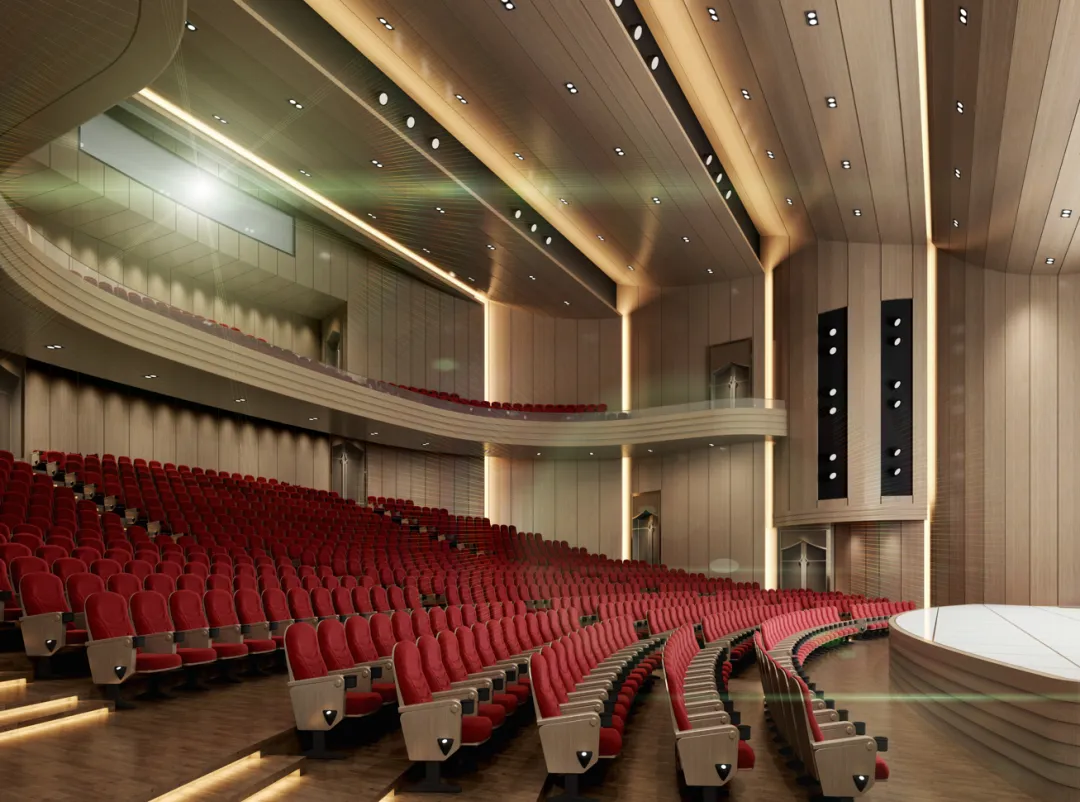
Auditorium Geometry and Reflection Control
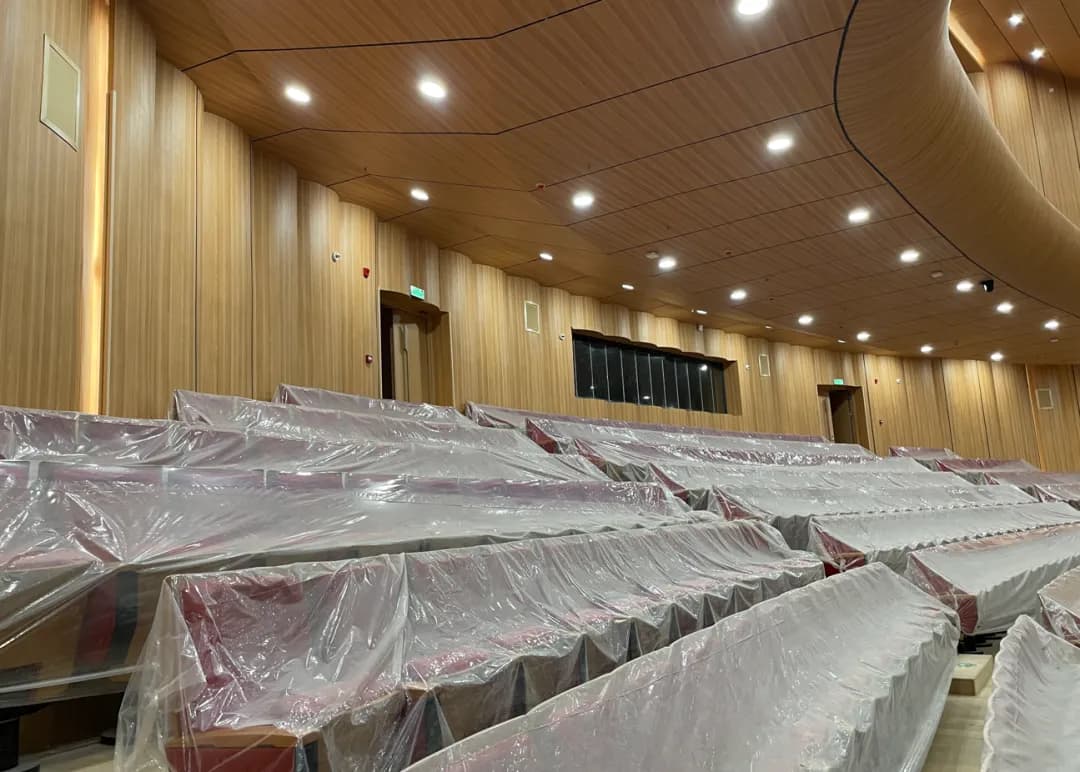
The auditorium geometry controls how direct sound and early reflections reach the audience. Ceiling and wall profiles, together with the acoustic properties of each finish, were developed to distribute useful reflected energy evenly across the stalls and balcony.
We systematically analyzed and optimized the proscenium splayed walls, side walls, rear walls, main ceiling, under-balcony ceiling, and balcony fascias. The concave rear side walls were refined to avoid sound focusing, while the rear wall and fascias were optimized to prevent echoes. Unfavorable acoustic openings were carefully controlled so the auditorium could achieve broad reflected sound coverage without interior acoustic defects.
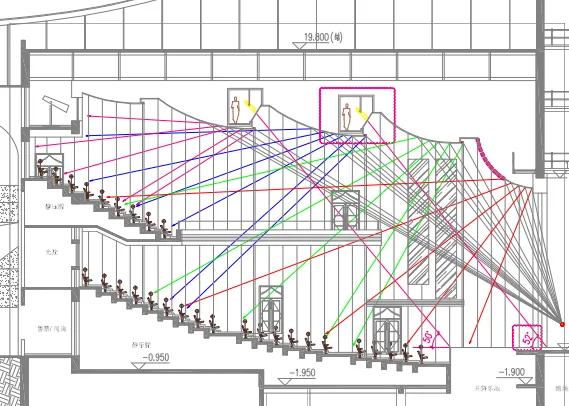
ODEON Acoustic Simulation and Material Specification
After optimizing the auditorium geometry, LYN used ODEON room-acoustic simulation to test the design and establish performance requirements for each interior boundary. Material specifications combined simulated results with measured absorption data and prior project experience.
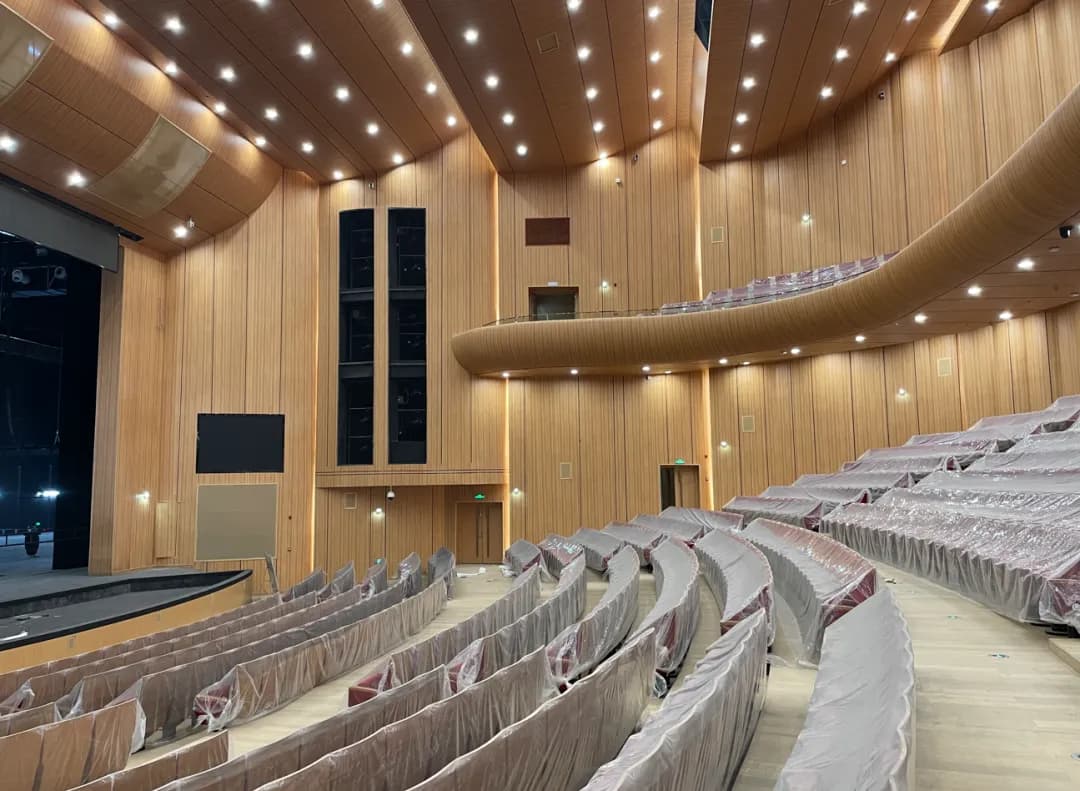
For instance, the wooden GRG shaping on the side walls requires a material surface mass density of no less than 50kg/m², while the seating requires specific sound absorption coefficients across the frequency spectrum.
Acoustic material controls were also implemented for the orchestra pit, stage, sound bridges, front lighting bridges, follow-spot room, sound control room, orchestra shell, and lighting and audio control rooms. Building on this foundation, acoustic simulation verified reverberation time and reviewed distribution maps for C80, G, LF, and other parameters while checking for potential acoustic defects.
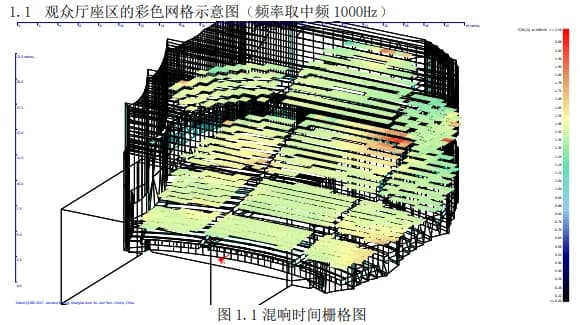
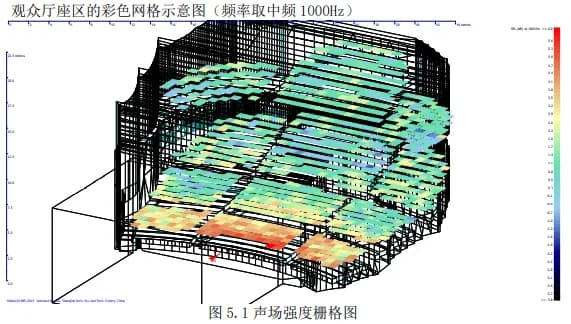
On-Site Acoustic Testing and Measured Results
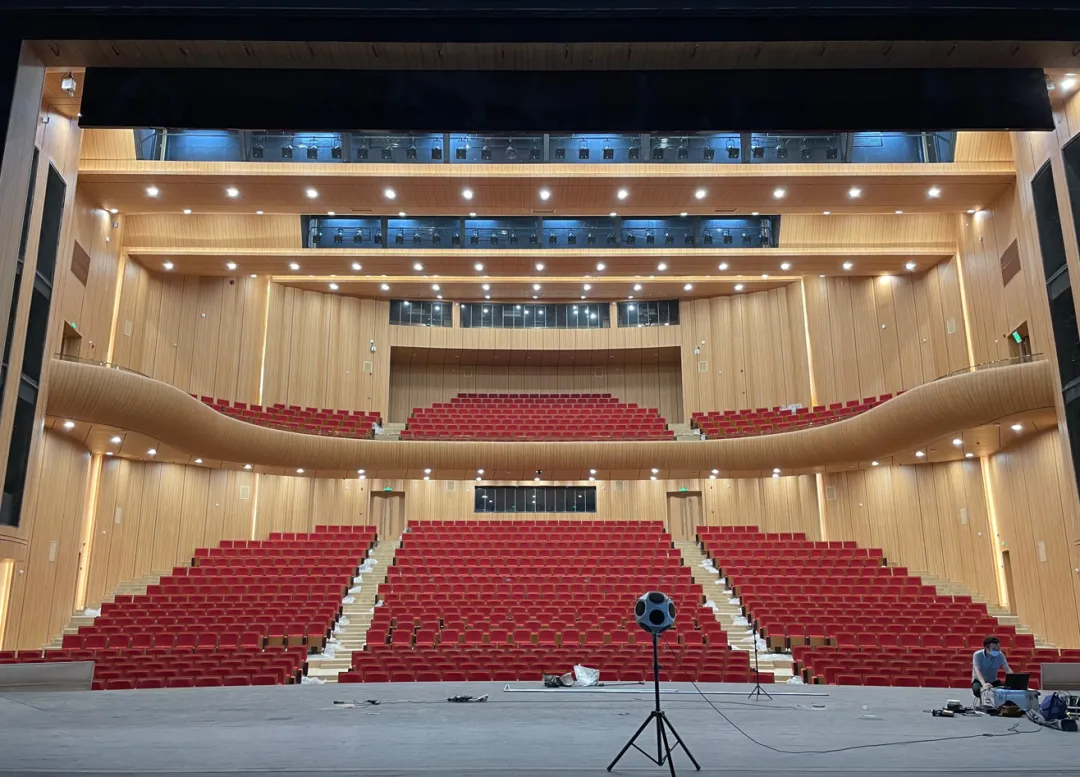
On July 25, 2022, LYN conducted on-site acoustic acceptance testing in Yuyao during outdoor temperatures of 40 degrees Celsius. The stage curtains had not yet been installed, which increased reverberation on stage and required the test configuration to be documented carefully.
The proscenium fire curtain was lowered to establish a controlled test condition. Auditorium measurements were then recorded for reverberation time, early decay, sound strength, initial time-delay gap, musical clarity, lateral energy, and background noise.
| Parameter | Value | Notes |
|---|---|---|
| RT (Mid-frequency) | 1.75 | Reverberance. Unoccupied, closed proscenium. Preferred occupied range: 1.3 to 1.5s. |
| EDT (Mid-frequency) | 1.74 | Reverberance. Preferred design value: 1.4 to 1.8. |
| G (Mid-frequency) | 3.1 | Strength of mid-frequency sound energy. Preferred design value: -1 to 2 dB. |
| ITDG | 27 | Intimacy. Preferred design value: ≤30. |
| C80,3 | 1.3 | Musical clarity. Preferred design value: 1 to 3 dB. |
| LFE4 | 0.24 | Spaciousness. Preferred design value: 0.15 to 0.35. |
| Background Noise | NR-25 | Quietness. Preferred design value: NR-30. |